 |
This is a file from the Wikimedia Commons. Information from its description page there is shown below.
Commons is a freely licensed media file repository. You can help.
|
| Description |
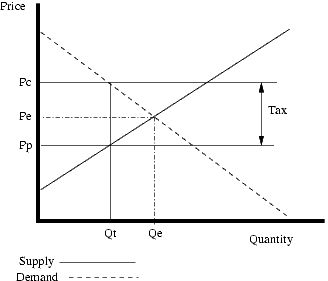
English: A diagram showing the effect of a per unit tax on the standard supply and demand diagram. Created by jrincayc for the purpose of illustrating the effect of taxes and subsidies on price.
|
| Date |
2002-12-20 (original upload date) |
| Source |
Transferred from en.wikipedia |
| Author |
Original uploader was Jrincayc at en.wikipedia |
Permission
( Reusing this file) |
Released under the GNU Free Documentation License.
|
Licensing
 |
Permission is granted to copy, distribute and/or modify this document under the terms of the GNU Free Documentation License, Version 1.2 or any later version published by the Free Software Foundation; with no Invariant Sections, no Front-Cover Texts, and no Back-Cover Texts.
Subject to disclaimers.www.gnu.org/copyleft/fdl.htmlGFDLGNU Free Documentation Licensetruetrue
|
 |
File:Tax supply and demand.svg is a vector version of this file.
It should be used in place of this raster image when superior.
File:Tax supply and demand.png  File:Tax supply and demand.svg
For more information about vector graphics, read about Commons transition to SVG.
There is also information about MediaWiki's support of SVG images.
|
|
File usage
The following pages on Schools Wikipedia link to this image (list may be incomplete):
Schools Wikipedia has been carefully checked to give you the best learning experience. SOS Childrens Villages works in 133 countries and territories across the globe, helps more than 62,000 children, and reaches over 2 million people in total. You can help by sponsoring a child.


