
File:Population of Israel.png
Size of this preview: 509 × 480 pixels.
| |
This is a file from the Wikimedia Commons. Information from its description page there is shown below.
Commons is a freely licensed media file repository. You can help. |
outdated
| Description |
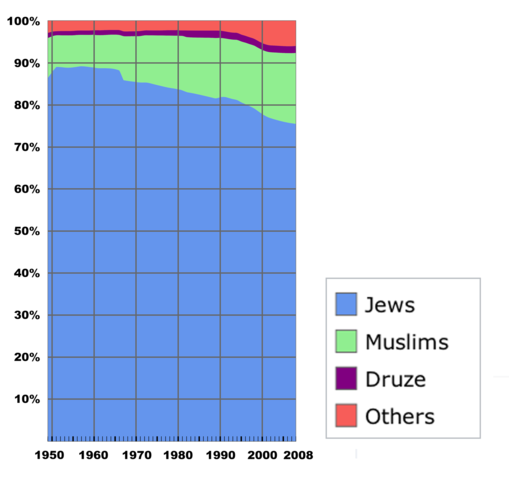
English: Population chart of Israel, since 1949
|
| Date | 2010-06-29 05:27 (UTC) |
| Source |
|
| Author |
|
| This is a retouched picture, which means that it has been digitally altered from its original version. Modifications: full chart + fixed fonts. The original can be viewed here: Population_of_Israel.svg. Modifications made by TheCuriousGnome.
|
|

Summary
Israeli population in thousands. Compiled from data from the Central Bureau of Statistics.
| ___Year___ | ___Jews___ | ___Muslims___ | ___Druze___ | ___Grand Total___ |
| 1949 | 1,013.9 | 111.5 | 14.5 | 1,173.9 |
| 1950 | 1,203.0 | 116.1 | 15.0 | 1,370.1 |
| 1951 | 1,404.4 | 118.9 | 15.5 | 1,577.8 |
| 1952 | 1,450.2 | 122.8 | 16.1 | 1,629.5 |
| 1953 | 1,483.6 | 127.5 | 16.8 | 1,669.4 |
| 1954 | 1,526.0 | 131.8 | 18.0 | 1,717.8 |
| 1955 | 1,590.5 | 136.2 | 19.0 | 1,789.1 |
| 1956 | 1,667.5 | 141.3 | 19.8 | 1,872.4 |
| 1957 | 1,762.8 | 146.8 | 20.5 | 1,976.0 |
| 1958 | 1,810.2 | 152.8 | 21.4 | 2,031.7 |
| 1959 | 1,858.8 | 159.2 | 22.3 | 2,088.7 |
| 1960 | 1,911.3 | 166.3 | 23.3 | 2,150.4 |
| 1961(4) | 1,981.7 | 174.9 | 26.3 | 2,234.2 |
| 1962 | 2,068.9 | 183.0 | 27.3 | 2,331.8 |
| 1963 | 2,155.6 | 192.2 | 28.5 | 2,430.1 |
| 1964 | 2,239.2 | 202.3 | 28.6 | 2,525.6 |
| 1965 | 2,299.1 | 212.4 | 29.8 | 2,598.4 |
| 1966 | 2,344.9 | 223.0 | 31.0 | 2,657.4 |
| 1967 | 2,383.6 | 289.6 | 32.1 | 2,776.3 |
| 1968 | 2,434.8 | 300.8 | 33.3 | 2,841.1 |
| 1969 | 2,506.8 | 314.5 | 34.6 | 2,929.5 |
| 1970 | 2,582.0 | 328.6 | 35.9 | 3,022.1 |
| 1971 | 2,662.0 | 344.0 | 37.3 | 3,120.7 |
| 1972(4) | 2,752.7 | 360.6 | 37.8 | 3,225.0 |
| 1973 | 2,845.0 | 377.2 | 39.3 | 3,338.2 |
| 1974 | 2,906.9 | 395.2 | 40.8 | 3,421.6 |
| 1975 | 2,959.4 | 411.4 | 42.2 | 3,493.2 |
| 1976 | 3,020.4 | 429.0 | 43.9 | 3,575.4 |
| 1977 | 3,077.3 | 446.5 | 45.6 | 3,653.2 |
| 1978 | 3,141.2 | 463.5 | 47.3 | 3,737.6 |
| 1979 | 3,218.4 | 481.2 | 49.0 | 3,836.2 |
| 1980 | 3,282.7 | 498.3 | 50.7 | 3,921.7 |
| 1981 | 3,320.3 | 513.7 | 52.3 | 3,977.7 |
| 1982 | 3,373.2 | 530.8 | 65.6 | 4,063.6 |
| 1983(4) | 3,412.5 | 542.2 | 68.0 | 4,118.6 |
| 1984 | 3,471.7 | 559.7 | 70.0 | 4,199.7 |
| 1985 | 3,517.2 | 577.6 | 72.0 | 4,266.2 |
| 1986 | 3,561.4 | 595.0 | 74.0 | 4,331.3 |
| 1987 | 3,612.9 | 614.5 | 76.1 | 4,406.5 |
| 1988 | 3,659.0 | 634.6 | 78.1 | 4,476.8 |
| 1989 | 3,717.1 | 655.2 | 80.3 | 4,559.6 |
| 1990 | 3,946.7 | 677.7 | 82.6 | 4,821.7 |
| 1991 | 4,144.6 | 701.4 | 84.8 | 5,058.8 |
| 1992 | 4,242.5 | 725.4 | 87.1 | 5,195.9 |
| 1993 | 4,335.2 | 751.4 | 89.3 | 5,327.6 |
| 1994 | 4,441.1 | 781.5 | 91.7 | 5,471.5 |
| 1995(4) | 4,522.3 | 811.2 | 92.2 | 5,612.3 |
| 1996 | 4,616.1 | 839.9 | 94.5 | 5,757.9 |
| 1997 | 4,701.6 | 867.9 | 96.7 | 5,900.0 |
| 1998 | 4,785.1 | 899.8 | 99.0 | 6,041.4 |
| 1999 | 4,872.8 | 934.1 | 101.2 | 6,209.1 |
| 2000 | 4,955.4 | 970.0 | 103.8 | 6,369.3 |
| 2001 | 5,025.0 | 1,004.6 | 106.3 | 6,508.8 |
| 2002 | 5,094.2 | 1,038.3 | 108.5 | 6,631.1 |
| 2003 | 5,165.4 | 1,072.5 | 110.8 | 6,748.4 |
| 2004 | 5,237.6 | 1,107.4 | 113.0 | 6,869.5 |
| 2005 | 5,313.8 | 1,140.6 | 115.2 | 6,990.7 |
| 2006 | 5,393.4 | 1,173.1 | 117.5 | 7,116.7 |
| 2007 | 5,478.2 | 1,206.1 | 119.7 | 7,243.6 |
| 2008 | 5,569.2 | 1,240.0 | 121.9 | 7,374.0 |
File usage
The following pages on Schools Wikipedia link to this image (list may be incomplete):
The best way to learn
SOS Childrens Villages chose the best bits of Wikipedia to help you learn. SOS Children's Villages helps those who have nothing and no one, giving them back the famly they have lost and bringing them the very best opportunities for a happy, healthy future. We have helped children in Africa for many years - you can help too...