
File:Usage share of web browsers (Source StatCounter).svg
Size of this preview: 480 × 480 pixels.
| |
This is a file from the Wikimedia Commons. Information from its description page there is shown below.
Commons is a freely licensed media file repository. You can help. |
Summary
| Description |
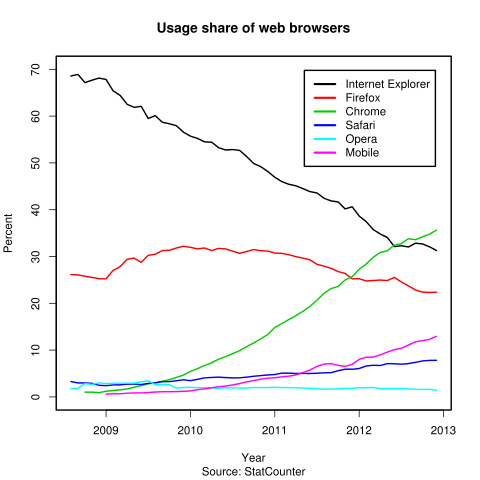
English: Here is the R code that created this graph, using figures from StatCounter's "Browser" and "Mobile vs. Desktop" data, e.g. http://gs.statcounter.com/#browser-ww-monthly-200807-201211 and http://gs.statcounter.com/#mobile_vs_desktop-ww-monthly-200812-201211
browser.names = c("Internet Explorer", "Firefox", "Chrome", "Safari", "Opera", "Mobile")
browser.years = c(
 2012.917, 2012.833, 2012.75, 2012.667, 2012.583, 2012.5, 2012.417, 2012.333, 2012.25, 2012.167, 2012.083, 2012,
 2011.917, 2011.833, 2011.75, 2011.667, 2011.583, 2011.5, 2011.417, 2011.333, 2011.25, 2011.167, 2011.083, 2011,
 2010.917, 2010.833, 2010.75, 2010.667, 2010.583, 2010.5, 2010.417, 2010.333, 2010.25, 2010.167, 2010.083, 2010,
 2009.917, 2009.833, 2009.75, 2009.667, 2009.583, 2009.5, 2009.417, 2009.333, 2009.25, 2009.167, 2009.083, 2009,
 2008.917, 2008.833, 2008.75, 2008.667, 2008.583)

browser.ie = c(31.27,32.08,32.7,32.85,32.04,32.31,32.12,34.07,34.81,35.75,37.45,38.65,40.63,40.18,41.66,41.89,42.45,43.58,43.87,44.52,45.11,45.44,46.00,46.94,48.16,49.21,49.87,51.34,52.68,52.86,52.77,53.26,54.44,54.50,55.25,55.72,56.57,57.96,58.37,58.69,60.11,59.49,62.09,61.88,62.52,64.43,65.41,67.84,68.14,67.68,67.16,68.91,68.57)

browser.firefox = c(22.38,22.32,22.4,22.85,23.73,24.56,25.55,24.87,24.98,24.88,24.78,25.27,25.23,26.39,26.79,27.49,27.95,28.34,29.29,29.67,29.98,30.37,30.68,30.76,31.17,31.24,31.50,31.09,30.69,31.15,31.64,31.74,31.27,31.83,31.64,31.97,32.21,31.82,31.34,31.28,30.50,30.26,28.75,29.67,29.40,27.85,27.03,25.23,25.27,25.54,25.77,26.08,26.14)
browser.chrome = c(35.64,34.77,34.21,33.59,33.81,32.76,32.43,31.23,30.87,29.84,28.4,27.27,25.69,25.00,23.61,23.16,22.14,20.65,19.36,18.29,17.37,16.54,15.68,14.85,13.35,12.39,11.54,10.76,9.88,9.24,8.61,8.06,7.29,6.71,6.04,5.45,4.66,4.17,3.69,3.38,3.01,2.80,2.42,2.07,1.73,1.52,1.38,1.21,0.93,1.02,1.03,NA,NA)
browser.safari = c(7.83,7.81,7.7,7.39,7.12,7,7.09,7.13,6.72,6.77,6.62,6.08,5.92,5.93,5.60,5.19,5.16,5.07,5.01,5.04,5.02,5.08,5.09,4.79,4.70,4.56,4.42,4.23,4.09,4.07,4.14,4.23,4.16,4.08,3.76,3.48,3.67,3.47,3.28,3.25,3.02,2.91,2.65,2.75,2.73,2.59,2.57,2.41,2.49,2.91,3.00,2.99,3.30)
browser.opera = c(1.43,1.63,1.61,1.63,1.72,1.77,1.77,1.72,1.78,2.02,1.95,1.98,1.82,1.81,1.72,1.67,1.66,1.74,1.84,1.91,1.97,2.00,2.00,2.07,2.01,2.00,2.03,1.88,1.91,1.91,1.96,1.82,1.97,1.97,2.00,2.06,2.02,1.88,2.62,2.67,2.64,3.46,3.23,2.96,2.94,2.95,2.92,2.83,3.01,2.69,2.86,1.83,1.78)
browser.mobile = c(12.96,12.3,12.03,11.78,11.09,10.4,10.11,9.58,8.99,8.53,8.49,8.04,6.95,6.55,6.74,7.12,7.02,6.53,5.75,5.21,4.70,4.45,4.30,4.10,4.02,3.81,3.50,3.21,2.86,2.57,2.32,2.18,1.96,1.72,1.56,1.28,1.21,1.15,1.12,1.12,1.05,0.94,0.86,0.86,0.80,0.69,0.67,0.60,NA,NA,NA,NA,NA)

browser.title = "Usage share of web browsers"
browser.sub = "Source: StatCounter"
browser.file = "Usage share of web browsers (Source StatCounter).svg"

svg(file=browser.file)
par(lwd=2)
plot(browser.years, browser.ie, type="l", ylim=c(0, 70), main=browser.title, sub=browser.sub, xlab="Year", ylab="Percent", col=1)
lines(browser.years, browser.firefox, col=2)
lines(browser.years, browser.chrome, col=3)
lines(browser.years, browser.safari, col=4)
lines(browser.years, browser.opera, col=5)
lines(browser.years, browser.mobile, col=6)

legend("topright",inset=0.04,col=1:6,lwd=3,legend=browser.names)

dev.off()
Instructions to run this (works on Ubuntu)
|
| Date | 6 January 2012 |
| Source | Own work |
| Author | Daniel.Cardenas, Litehacker |
Licensing
|
File usage
The following pages on Schools Wikipedia link to this image (list may be incomplete):
Metadata
Learn more about Schools Wikipedia
SOS Children's Villages has brought Wikipedia to the classroom. SOS Childrens Villages believes that a decent childhood is essential to a happy, healthy. Our community work brings families new opportunities through education, healthcare and all manner of support. Why not try to find out more about sponsoring a child?