 |
This is a file from the Wikimedia Commons. Information from its description page there is shown below.
Commons is a freely licensed media file repository. You can help.
|
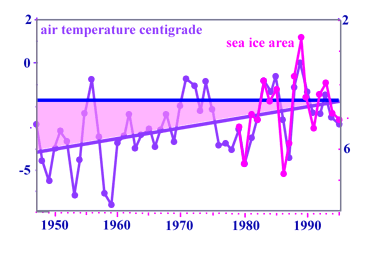
temperature and pack ice area - the scale for the ice is inverted to demonstrate the correlation - the horizontal line is the freezing point - the oblique line the average of the temperature - in 1995 the temperature reached the freezing point Uwe Kils.
I, the copyright holder of this work, hereby publish it under the following licenses:
 |
Permission is granted to copy, distribute and/or modify this document under the terms of the GNU Free Documentation License, Version 1.2 or any later version published by the Free Software Foundation; with no Invariant Sections, no Front-Cover Texts, and no Back-Cover Texts. A copy of the license is included in the section entitled GNU Free Documentation License. http://www.gnu.org/copyleft/fdl.htmlGFDLGNU Free Documentation Licensetruetrue
|
You may select the license of your choice.
|
after data from Loeb V, Siegel V, Holm-Hansen O, Hewitt R, Fraser W, et al. 1997 Effects of sea-ice extent and krill or salp dominance on the Antarctic food web. Nature 387: 897–900.
 |
This graph image could be recreated using vector graphics as an SVG file. This has several advantages; see Commons:Media for cleanup for more information. If an SVG form of this image is already available, please upload it. After uploading an SVG, replace this template with {{ vector version available|new image name.svg}}. |
File usage
The following pages on Schools Wikipedia link to this image (list may be incomplete):
Through Schools Wikipedia, SOS Children's Villages has brought learning to children around the world. SOS Children cares for children who have lost their parents. Our Children's Villages give these children a new home and a new family, while a high-quality education and the best of medical care ensures they will grow up with all they need to succeed in adult life. Would you like to sponsor a child?


