
File:Temp-sunspot-co2.svg
| |
This is a file from the Wikimedia Commons. Information from its description page there is shown below.
Commons is a freely licensed media file repository. You can help. |
| Description |
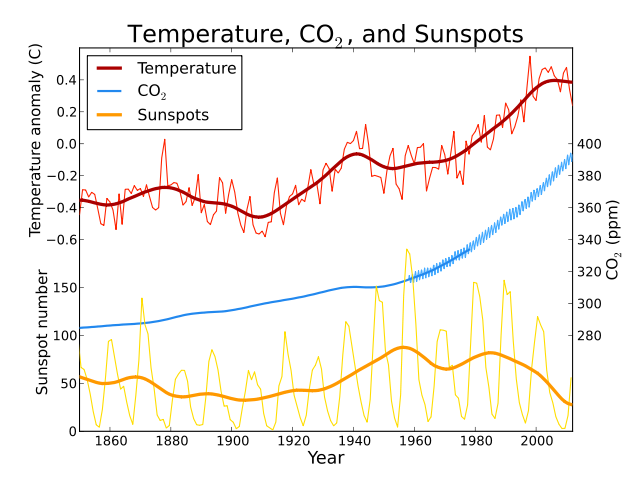
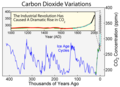
English: Global average temperature, atmospheric CO2, and sunspot activity since 1850. Thick lines for temperature and sunspots represent a 25 year moving average smoothing of the raw data.
|
| Date | 11 January 2009 (first version); 10 March 2007 (last version) |
| Source | Transferred from en.wikipedia; transferred to Commons by User:Anrie using CommonsHelper. |
| Author | Original uploader was Leland McInnes at en.wikipedia |
| Permission ( Reusing this file) |
Released under the GNU Free Documentation License. |
Global average temperature, atmospheric CO2, and sunspot activity since 1850. Thick lines for temperature and sunspots represent a 25 year moving average smoothing of the raw data.
This figure was produced by Leland McInnes using python and matplotlib and is licensed under the GFDL. All data is from publicly available sources.
Contents
|
Data Sources
- (light blue) Law Dome CO2 Data: ftp://ftp.ncdc.noaa.gov/pub/data/paleo/icecore/antarctica/law/law_co2.txt
- (blue) Mauna Loa CO2 data: http://www.esrl.noaa.gov/gmd/ccgg/trends/co2_mm_mlo.dat
- (red) Temperature Data: http://www.cru.uea.ac.uk/cru/data/temperature/hadcrut3gl.txt
- (orange) Sunspot data: http://sidc.oma.be/DATA/yearssn.dat
Plot Generation
The plot was generated by the following Python script:
# -*- coding: utf-8 -*-
import numpy as np
import matplotlib.pylab as plt
import urllib

def smooth(signal, window_size):
    extended_signal = signal[window_size:0:-1] + signal + signal[-1:-window_size:-1]
    s = np.array(extended_signal)
    w = np.hamming(window_size)
    y = np.convolve(w/w.sum(), s, mode="same")
    return y[window_size:-window_size+1]

temp_file = urllib.urlopen("http://www.cru.uea.ac.uk/cru/data/temperature/hadcrut3gl.txt")
data_rows = [x.split() for x in temp_file][0:-1:2]
temp_years = [int(x[0]) for x in data_rows]
temps = [float(x[-1]) for x in data_rows]

#co2_file = urllib.urlopen("http://web.archive.org/web/20070829134646/http://www.esrl.noaa.gov/gmd/ccgg/trends/co2_mm_mlo.dat")
co2_file = urllib.urlopen("ftp://ftp.cmdl.noaa.gov/ccg/co2/trends/co2_mm_mlo.txt")
data_rows = [x.split() for x in co2_file if not x.startswith("#") and x.find("-99.99") == -1]
co2_years = [(float(x[0]) + (float(x[1])-0.5)/12.) for x in data_rows]
co2concs = [float(x[3]) for x in data_rows]

lawco2_file = urllib.urlopen("ftp://ftp.ncdc.noaa.gov/pub/data/paleo/icecore/antarctica/law/law_co2.txt")
data_rows = [x.split() for x in lawco2_file if x.startswith("     1")]
del data_rows[[float(x[0]) for x in data_rows].index(1010.):]
lawco2_years = [float(x[0]) for x in data_rows]
lawco2concs = [float(x[-1]) for x in data_rows]

sunspot_file = urllib.urlopen("http://sidc.oma.be/DATA/yearssn.dat")
data_rows = [x.split() for x in sunspot_file if "*" not in x]
sun_years = [float(x[0]) for x in data_rows]
sunspots = [float(x[-1]) for x in data_rows]

smoothed_temps = smooth(temps, 25)
smoothed_sunspots = smooth(sunspots, 25)

base_ax = plt.axes()
base_ax.yaxis.tick_left()
plt.yticks([])
plt.xlim(1850,2012)
plt.xlabel("Year", size=16)
plt.title("Temperature, CO$_2$, and Sunspots", size=22)

temp_ax = plt.axes([0.125,0.5,0.775,0.4], frameon=False)
temp_ax.yaxis.tick_left()
plt.plot(temp_years, temps, '#FF2200')
tline  = plt.plot(temp_years, smoothed_temps, '#AA0000', lw=3)
plt.xlim(1850,2012)
plt.yticks(np.arange(-0.6,0.6,0.2))
plt.ylabel(u'Temperature anomaly (C)', size=14)
plt.xticks([])

co2_ax = plt.axes([0.125,0.3,0.775,0.4], frameon=False)
co2_ax.yaxis.tick_right()
co2_ax.yaxis.set_label_position("right")
co2_ax.xaxis.tick_bottom()
plt.plot(co2_years, co2concs, '#44AAFF')
cline = plt.plot(lawco2_years, lawco2concs, '#2288EE', lw=2)
plt.xlim(1850,2012)
plt.ylabel(r'CO$_2$ (ppm)', size=14)
plt.xticks([])

sun_ax = plt.axes([0.125,0.1,0.775,0.4], frameon=False)
sun_ax.yaxis.tick_left()
plt.plot(sun_years, sunspots, "#FFDD00")
sline = plt.plot(sun_years, smoothed_sunspots, "#FF9900", lw=3)
plt.xlim(1850,2012)
plt.yticks(np.arange(0,200,50))
plt.ylabel("Sunspot number", size=14)
plt.xticks([])

plt.axes(base_ax)
t_proxy = plt.Line2D([0], [0], c='#AA0000', lw=3)
c_proxy = plt.Line2D([0], [0], c='#2288EE', lw=3)
s_proxy = plt.Line2D([0], [0], c='#FF9900', lw=3)
plt.legend((t_proxy, c_proxy, s_proxy), ("Temperature", "CO$_2$", "Sunspots"), "upper left")

#plt.legend((tline, cline, sline), ("Temperature", "CO$_2$", "Sunspots"), "upper left")
plt.savefig("temp-co2-sunspot.svg")
plt.show()
The plot can likely be updated for more recent data using these same script, though minor modifications may be required for changes in data formats, locations, etc.
Related Images
-
-
-
-
Sunspot-temperature-10000yr.svg
-
Licensing
|

File usage
Metadata
The best way to learn
Schools Wikipedia has been carefully checked to give you the best learning experience. In 133 nations around the world, SOS Childrens Villages works to bring better education and healthcare to families in desperate need of support. Sponsoring a child is the coolest way to help.